A Full Case Study on Treating Bakery Wastewater
An MBBR system was installed at a bakery in which the owner/operator, attempting to save cost, forced a smaller size equalization tank, hired unqualified operators and failed to follow operating instructions, causing the system to fail. Following some discussion, it was agreed to hire a large and reputable outside consulting firm to assess the system and offer advice.
An MBBR system was installed at a bakery in which the owner/operator, attempting to save cost, forced a smaller size equalization tank, hired unqualified operators and failed to follow operating instructions, causing the system to fail. Following some discussion, it was agreed to hire a large and reputable outside consulting firm to assess the system and offer advice.
An 8-week, 56-day Moving Bed Bioreactor (MBBR) study was performed using equalized wastewater from the bakery and plastic carrier media to provide growth surface for the microbe. The study confirmed that organic reduction is possible using this technology. Combined with treatment modeling and simulation work, the consulting firm evaluated the process conditions required to establish and maintain good treatment.
These process conditions include upsizing the equalization tank to match the daily flow. Maintaining the pH levels to a 6.8 - 7.8 range. Eliminating toxic disinfectants was required, also, adding nutrients for biological growth (nitrogen and phosphorus), adding alkalinity, and dosing antifoam as needed.
Due to the highly complex nature of industrial wastewater, it was determined that the owner/operator had unqualified employees running the system. It was recommended that the treatment system reconfiguration be carefully directed by a licensed professional engineer (PE) with a high level of subject matter (MBBR) expertise. In addition, the treatment system should be documented in a well written WWTP Operations & Maintenance (O&M) Manual and include a comprehensive operator training program.
1. INTRODUCTION/BACKGROUND
The bakery purchased a modular-pre-engineered wastewater treatment system from Ecologix Environmental Systems LLC (Ecologix). The core unit processes are equalization tank, a primary DAF, and an MBBR involving biofilm carrier (MBBR Biochips 30). A secondary DAF, following the MBBR has been placed for further solids/liquid separation of biomass generated by the biological process.
Prior to the MBBR, the DAF has removed an average of about 90% - 95% of TSS and FOG, reducing BOD by about 57%, based on data collected over a period of 20 months between January 4, 2019, and September 19, 2020.
TEST OBJECTIVES
At first, the bakery was unable to maintain and grow biomass on the BioChip carriers and achieve the treatment required to substantially reduce or eliminate discharge surcharges for Biochemical Oxygen Demand (BOD) and Total Suspended Solids (TSS). Permitted discharge surcharge thresholds and limits are listed in Table 1.
| Parameter | Permit Surcharge Limit |
|---|---|
| pH | 5.5 - 12 |
| Temperature | |
| TSS | 350 mg/L |
| BOD5 | 250 mg/L |
| Oil and Grease | Monitor Only |
An eight-week, 56-day, bench test was conducted from January 16, 2020 to March 12, 2020 in order to confirm the conditions required for effective biological treatment and that biomass could be grown and maintained on conventional carriers. The specific objectives of the bench test were:
- Assess whether biofilm attachment and growth will occur in an MBBR reactor that is fed equalized wastewater sufficiently treated to remove FOG.
- Evaluate the degree of treatment that can be achieved in the existing system (1.2-day retention time) under varying loading conditions and assuming good DAF performance.
- Evaluate the degree of treatment that can be achieved in an ideally sized system (2.4-day retention time) under varying loading conditions and assuming good DAF performance.
- Evaluate MBBR effluent solids removal in a simulated, secondary DAF.
- Utilize data collected during the bench test to develop a Basis of Design (BOD) and key process conditions required for treatment system operation and performance including equalization, pretreatment with DAF, pH, temperature (worst case), FOG, C/N/P ratios, and aeration requirements.
3. TESTING PROCEDURE
3.1 Bench Reactor Operation and Monitoring
DAF effluent was collected once every other week and transported to the bench lab, where it was characterized and then processed in a flow-through, bench-scale, MBBR reactor. The reactor was seeded with a sample of inoculated MBBR media.
The reactor was sized and constructed to match the flow, temperature, and retention time conditions in the Bakery's existing MBBR system. The target operational parameters are listed with average results from testing in Table 2. Nutrients (Nitrogen and Phosphorus) were added to the reactor in ratios required for biological growth. Initially, pH was adjusted using dilute sulfuric acid and sodium hydroxide to maintain an optimal range of 6.8 - 8.0 s.u. in the reactor; however, this was not enough to moderate the wide pH swings caused by the partial breakdown of the wastewater organics into organic acids.
| Parameter | Units | Target | Test Average |
|---|---|---|---|
| Influent/Effluent Pumping Rate | gpd ml/min | 1.0 2.63 | 1.0 2.6 |
| Effluent flowrate | Gpd | - | 0.78 |
| Hydraulic Retention Time | Days | 1.2 | 1.3 |
| Reactor Volume (Flow Through) | Gallons | 1.2 | 1.3 |
| Cumulative Influent | Gallons | - | 56.4 |
| Cumulative Effluent | Gallons | - | 56.4 |
| Evaporative and Foaming Loss | Gallons | - | 12.6 |
| Media Fill Volume | Gallons | 0.6 (50% fill) | 0.6 (50% fill) |
| Total Media Area | m2/m3 | 650 | 650 |
| Temperature (reactor heated in water bath) | °F | 100 | 99.0 |
| pH Range (prior to alkalinity addition) | s.u. | 6.8 - 8.0 | 2.0 - 10.5 (Average of 6.0) |
| pH Range (after alkalinity addition) | s.u. | 6.8 - 8.0 | 5.6 - 7.6 (Average of 6.8) |
| Minimum Dissolved Oxygen (DO) Concentration | mg/L | 2-3 | 1.4 |
| Nitrogen addition (as needed) | Mass Ratio N:COD/2 | 5:100 | 5:100 |
| Phosphorus addition (as needed) | Mass Ratio P:COD/2 | 1:100 | 1:100 |
| Alkalinity Addition (Sodium Carbonate) | g/gallon | 10 | 12.8 |
| Alkalinity Addition (1 M. Magnesium Hydroxide) | mL/gallon | - | 29 |
* Nitrogen and phosphorus addition to be based on ½ the total COD concentration to approximate BOD.
Alkalinity addition, not just pH adjustment, was required to maintain the pH within the desired range and this was a very important discovery that affects the full-scale system design and operation.
The initial reactor upset and loss of attached growth that occurred due to pH and temperature swings is discussed in more detail in the next section. In response to the reactor upset, sodium carbonate and magnesium hydroxide were added to the wastewater feed to provide the additional alkalinity required to maintain reactor pH in the ideal range.
The raw wastewater was fed to the reactor according to the ramp up schedule in Table 3. The purpose of the ramp up schedule was to allow the reactor to acclimate to the high Chemical Oxygen Demand (COD) and BOD in the wastewater by increasing to full organic loading week by week. The ramp up schedule was delayed during the bench testing due to a reactor upset event and loss of biomass attached growth; however, full loading was achieved during the last two weeks of testing.
| Date | Percent Wastewater by Volume | Percent Deionized Water by Volume |
|---|---|---|
| Week 1 | 50% | 50% |
| Week 2 | 75% | 25% |
| Week 3 | 90% | 10% |
| Week 4 | 90% | 10% |
| Week 5 | 75% | 25% |
| Week 6 | 90% | 10% |
| Week 7 | 100% | 0% |
| Week 8 | 100% | 0% |
3.2 Reactor Upset, Response, and Lessons Learned
The lab experienced challenges maintaining the reactor at the target setpoint of 100°F which may have contributed to the reactor upset observed during the third week of testing. The reason for the high temperature setpoint was to test biological treatment under peak summer temperature conditions. The reactor heater overshot the setpoint increasing reactor temperature to above 104°F on several occasions in the first two weeks of testing. Reactor temperature was as high as 113°F at one point. These temperatures were high enough to spur changeover from mesophilic to thermophilic operation and may have caused disruption to the attached growth early on in reactor operations. The lab quickly responded to the temperature issues by lowering the water bath setpoint to prevent overshooting and the reactor temperature was generally well-maintained for the remainder of testing.
During week three of testing, when the fed wastewater strength was increased to 90%, reactor foaming and significant biomass loss occurred. Up until this point, the lab adjusted both the wastewater feed and reactor pH daily to maintain reactor pH between 6.8 and 8.0 standard units (s.u.) using dilute sodium hydroxide or sulfuric acid; however, daily adjustment was insufficient to maintain an acceptable pH range within the reactor. Reactor pH often fell to 2 to 4 s.u. overnight during the first two weeks of operation. This substantial drop in reactor pH was the result of partial treatment of wastewater organics.
We believe that partial treatment resulted in the formation of organic acids that exceeded the available alkalinity and caused the pH to drop in the reactor. The lab was directed to begin adding alkalinity via magnesium hydroxide to the wastewater feed and to the reactor directly. The lab began monitoring pH twice daily and over the weekends until operations stabilized. Sodium carbonate was initially added to the wastewater feed while awaiting a shipment of magnesium hydroxide (preferred chemical). When the 1 molar (1 M) magnesium hydroxide was available, this was added to both the reactor and wastewater feed tank. The rate of soda ash used was 12.8 grams per gallon of wastewater fed. The rate of 1 M magnesium hydroxide used was 29 mL per gallon of wastewater fed. Magnesium hydroxide was the preferred chemical for alkalinity addition and pH adjustment because it buffers to a maximum pH of around 9 s.u. thus mitigating the risk for pH swings too far in the opposite direction.
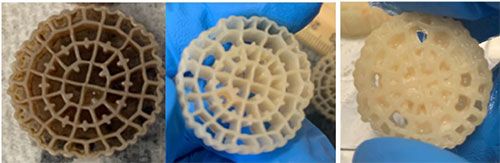
The initial temperature and pH swings described above were believed to cause the loss of attached growth from the biomass carriers/media. Figure 1 includes photos of initial media conditions at reactor startup, conditions after the reactor upset, and conditions when biomass growth began to rebound during the final weeks of testing. Initially, the inoculated biomass was dark in color with biomass visible on the inner surfaces. After the upset, the media appeared bleached with little to no biomass visible. In the final weeks of testing, biomass began to reattach but remained light in color. Despite the loss of attached growth, oxygen uptake and COD reduction continued to occur after the upset indicating that suspended growth was still occurring in the system.
Lessons learned from the reactor upset were that alkalinity addition will be necessary in the full-scale system to maintain treatment efficiency and attached growth. Though magnesium hydroxide addition made sense in the context of the bench-scale testing because it reacts slowly and mitigated the risk of overshooting the pH in the reactor, the high addition rate used caused operational issues in the treatment system. The aeration stones became fouled with inorganic deposits and needed to be cleaned frequently during the last few weeks of testing to maintain reactor DO.
Inorganic solids were also observed at the bottom of the reactor when testing ended, and it is likely that some of the new film accumulated on the media was attributable to inorganic precipitate from the magnesium hydroxide addition. We recommend that a sodium-based chemical such as sodium bicarbonate, sodium carbonate, or soda ash be used to provide alkalinity in the full-scale system to reduce the risk of inorganic scaling.
3.3 Influent and Effluent Sampling
The raw wastewater samples were analyzed for total and soluble COD, total and soluble BOD, pH, temperature, ammonia, alkalinity, reactive phosphate, Total Suspended Solids and Volatile Suspended Solids (TSS and VSS), Total Kjeldahl Nitrogen (TKN), and Oil and Grease (O&G) as they were received. Bioreactor effluent was sampled and analyzed for pH, temperature, TSS and VSS, COD (total and Soluble), total alkalinity, reactive phosphate, ammonia, BOD5 (Total and Soluble), and Oil and Grease. This data is summarized in the next Section 4 of this memo.
4. SUMMARY OF RESULTS
4.1 Oxygen Uptake Rate Testing
Despite the loss of attached growth, bench monitoring data indicated that oxygen uptake and COD reduction continued to occur after the upset, meaning that suspended growth was still occurring in the system. We directed the treatability lab to conduct Oxygen Uptake Rate (OUR) testing to confirm biological activity. Both endogenous and fed OUR tests were carried out on February 21, 2020. One-liter beakers were filled halfway with media from the reactor and then filled to one liter with mixed liquor. The beakers were stirred and aerated to increase dissolved oxygen (DO) levels to 7 mg/L or greater. Aeration was then stopped, a timer was set, and DO drop was monitored until levels dropped to less than 1 mg/L. Wastewater (67 mL) with a total COD of 6,710 mg/L was added to target a COD spike of 250 mg/L. OUR increased approximately five times for the fed test indicating that active biomass was still present in the reactor mixed liquor.
| Data Received | 1/13/2020 | 1/27/2020 | 2/10/2020 | 2/24/2020 | Average | Averages from 2019 Sampling | Peak from 2019 Sampling | |
|---|---|---|---|---|---|---|---|---|
| Data Analyzed | 1/16/2020 | 1/28/2020 | 2/11/2020 | 2/26/2020 | ||||
| Parameters | Units | Sample 1 | Sample 2 | Sample 3 | Sample 4 | |||
| Flow | gpd | 9,300 | 12,664 | |||||
| pH | s.u. | 6.96 | 12.6 | 4.90 | 12.1 | 9.15 | 6.8 | 7.4 |
| Temperature | c | 12.3 | 8.2 | 15.8 | 24 | 15.1 | 24.3 | 25.3 |
| TSS | mg/L | 760 | 536 | 234 | 184 | 429 | 155 | 228 |
| VSS | mg/L | 750 | 438 | 228 | 144 | 390 | 141 | 205 |
| COD (Total) | mg/L | 12,231 | 4,960 | 6,719 | 8,890 | 8,198 | 9,770 | 13,020 |
| COD (Soluable) | mg/L | 11,350 | 4,920 | 6,530 | 8,530 | 7,833 | 7,732 | 11,450 |
| Total Alkalinity | mg/L CaCO3 | 320 | 710 | 80 | 1,630 | 685 | 101 | 311 |
| Phosphorus | mg/L | 0.00 | 2.79 | 3.18 | 0.49 | 1.62 | 0.81 | 1.3 |
| Ammonia | mg/L | 2.00 | 15.40 | 0.80 | 0.30 | 4.63 | 0.39 | 0.65 |
| BOD5 (Total) | mg/L | 4,940 | 3,510 | 4,780 | 7,520 | 5,188 | 5,767 | 7,851 |
| Total Kjeldahl Nitrogen | mg/L | 44.6 | 13.4 | 7.0 | 13.4 | 19.6 | 14.2 | 18.2 |
| Oil and Grease | mg/L | 284 | 15.5 | 6.9 | 8.8 | 78.8 | 6.4 | 10 |
4.2 Oxygen Uptake Rate Testing
Despite the loss of attached growth, bench monitoring data indicated that oxygen uptake and COD reduction continued to occur after the upset meaning that suspended growth was still occurring in the system. We directed the treatability lab to conduct Oxygen Uptake Rate (OUR) testing to confirm biological activity. Both endogenous and fed OUR tests were carried out on February 21, 2020. One-liter beakers were filled halfway with media from the reactor and then filled to one liter with mixed liquor. The beakers were stirred and aerated to increase dissolved oxygen (DO) levels to 7 mg/L or greater. Aeration was then stopped, a timer was set, and DO drop was monitored until levels dropped to less than 1 mg/L. Wastewater (67 mL) with a total COD of 6,710 mg/L was added to target a COD spike of 250 mg/L. OUR increased approximately five times for the fed test indicating that active biomass was still present in the reactor mixed liquor.
| Test | Test Duration (min.) | DO Drop (mg/L) | Ours (mg/L/hr) |
|---|---|---|---|
| Endogenous | 61 | 6.87 | 6.76 |
| Fed | 10 | 6.45 | 38.7 |
4.3 Assessment of Attached Growth
The lab observed the media visually to assess the degree of biofilm growth and fouling from inorganic material and oil and grease. The lab also photographed the media weekly and estimated the degree of biological growth by weight. As previously discussed in Section 3.2, much of the original attached growth on the inoculated media used for seeding was lost in the first two weeks of testing due to the temperature and pH upsets. The original biofilm was almost completely gone by week 4 at which point the lab stopped performing the mass analysis and relied on weekly visual observations until biological activity was confirmed.
The mass of biofilm on the media was assessed toward the end of week 2 of testing, and then assessed again during the final three weeks of testing. The change in biofilm mass was evaluated by establishing a tare weight for the media (average weight for samples of individual media) and then oven-drying and weighing several pieces of media (between 5 and 10) from the reactor to calculate the total mass of biofilm growth.
| Week | Date | Media tare weight (g) | Reactor media dry weight (g) | Mass increase (g) | Mass increase between measurements |
|---|---|---|---|---|---|
| 2 | 1/28/2020 | 0.98 | 1.03 | 0.05 | - |
| 6 | 2/25/2020 | 0.98 | 1.08 | 0.09 | - |
| 7 | 3/2/2020 | 0.98 | 1.20 | 0.22 | 12% |
| 8 | 3/13/2020 | 0.98 | 1.47 | 0.48 | 22% |
The biofilm mass increased by 36% or 0.39 g between week 6 and the close of testing. Some of the mass accumulated is likely the result of inorganic fouling from the magnesium hydroxide that was added as a source of alkalinity.
4.4 Reactor Performance and Effluent Quality
The bioreactor effluent (overflow) was monitored for key parameters to assess performance and removal efficiencies. The table below provides a summary of effluent parameters following the reactor upset. The data represents the last three weeks of operations after biological activity was confirmed through OUR testing on February 21, 2020. The return of attached biofilm growth was confirmed on March 2, 2020. Note that 90% strength wastewater was fed during week 6 and 100% strength wastewater was fed for weeks 7 and 8.
| Parameter | Units | No. of results | Minimum | Average | Maximum | Percent Removal |
|---|---|---|---|---|---|---|
| pH | ||||||
| COD | mg/L | 8 | 1,550 | 3,129 | 4,330 | 65% |
| Soluble COD | mg/L | 8 | 1,190 | 2,793 | 4,300 | 67% |
| TSS | mg/L | 8 | 224 | 531 | 1,532 | |
| VSS | mg/L | 8 | 120 | 362 | 848 | |
| BOD | mg/L | 2 | 741 | 749 | 756 | 90% |
| Ammonia | mg/L | 8 | 136 | 334 | 534 | |
| Reactive Phosphate | mg/L | 8 | 1.54 | 1.75 | 2.13 | |
| Alkalinity | mg/L | 8 | 800 | 1,393 | 1,950 |
Good organic removal performance was observed over the last few weeks of testing with 65% and 90% removal observed for COD and BOD, respectively. The graph below shows the influent total and soluble COD compared against the effluent total and soluble COD during the last three weeks of testing. This is good performance for a high rate reactor (loading rate of 20 g BOD /m2 / d or higher). BOD removal rates of 75-80% are typical for high-rate MBBR reactors1.
TSS increased by about 24% across the MBBR process. This increase indicated that biological growth was occurring. Secondary solids separation via DAF will be required to consistently reduce TSS and BOD below the discharge surcharge thresholds of 350 mg/L and 250 mg/L, respectively. The lab performed simple jar testing to qualitatively assess the floatability of the MBBR effluent solids.
4.5 Secondary DAF Simulation Testing
Two tests were performed to assess the flotation potential of the MBBR effluent solids with and without polymer. Coagulant and flocculant were added for the second set of tests. The same flocculant and coagulant doses used in the primary DAF were used in the testing. The tests were conducted in beakers with aeration stones. An initial turbidity measurement was taken. The MBBR effluent samples were then aerated for 5 minutes and a final turbidity measurement was taken. The lab observed a 4% reduction in turbidity for the testing with chemicals and a 7% reduction in turbidity for the testing without chemical addition. These tests were largely inconclusive. The lab did not observe major changes in the sample clarity or a significant amount of material floating to the top for either test. There are several reasons why this test may not have been successful:
- The method of introducing dissolved air using an aeration stone was not representative of how dissolved air is introduced in a full-scale DAF.
- The chemicals and/or dosages, which were identical to the chemical addition in the primary DAF, were not the optimal chemistry and dosages to use for the MBBR solids.
- The pH was not optimal for solids removal with the chemicals applied.
- The mixing of the incorporation of the treatment chemicals was incomplete, and they didn’t have time to react and bind to wastewater solids.
Though the qualitative DAF tests were largely inconclusive, we believe that DAF technology is still the best option for reducing TSS and BOD leaving the MBBR. We recommend that after the MBBR has been returned to service with the appropriate changes and modifications implemented, additional jar testing be conducted to identify the optimal secondary DAF design conditions and treatment chemistry to reduce or eliminate surcharges.
5. GPS-X BIOLOGICAL TREATMENT MODELING RESULTS
An MBBR model was built using GPS-X biological modeling software produced by Hydromantis. The model was structured using the average flow and 50th percentile and 94th percentile (maximum monthly or peak) COD concentrations from the wastewater characterization sampling data included in Table 4. The model was used to verify and reproduce treatment conditions observed during the last two few weeks of bench testing, and then used to verify effluent quality at both average and peak loading conditions. The model confirmed that a 14,700-gallon MBBR reactor operating under acclimated, steady-state conditions can achieve the COD and BOD removal efficiencies observed during the bench testing. In fact, the full-scale MBBR may produce more biomass and achieve better soluble BOD reduction than observed during the bench testing if conditions favorable for attached growth are maintained.
The GPS-X modeling confirmed the need for a downstream DAF to remove particulate BOD and TSS as predicted. Effluent TSS levels predicted by the model were expected to exceed what was seen during the bench testing. The GPS-X model was also used to assess the impact of doubling the MBBR tank volume by adding a second, identically sized tank to be run in parallel with the existing tank thereby reducing the loading by half. Doubling the reactor volume offered a marginal improvement in soluble BOD and COD reduction. There are multiple advantages to increasing MBBR capacity such as redundancy and better management of shock loads, but considering space limitations at the site, we do not believe more MBBR capacity is necessary to reduce surcharge payments. If the MBBR is effectively treating soluble organics as demonstrated during the final weeks of the bench study, a secondary DAF with an effective chemical treatment regimen should be able to reduce the remaining TSS and particulate BOD below the surcharge thresholds. We believe that the testing was largely inconclusive due to the limitations outlined in the section above and qualitative nature of the test. DAF is still the preferred technology for reducing TSS and particulate BOD leaving the MBBR1. We recommend that after the MBBR has been returned to service with the appropriate changes and modifications implemented, additional jar testing be conducted to identify the optimal secondary DAF design conditions and treatment chemistry to reduce or eliminate surcharges.
6. AERATION SYSTEM EVALUATION
We reviewed the existing aeration capacity and compared this to the theoretical oxygen demand assuming an average flow of 9,300 gpd and a peak BOD concentration of 7,851 mg/L. Sanitaire’s Diffused Aeration Design Guide was used to calculate the aeration demand. The calculated aeration requirement was then compared to the existing blower capacity. The existing blower capacity is 728 scfm combined for the two installed blowers. A peak wastewater design temperature of 100°F (38°C) was used for the evaluation. Additional blower capacity, a third identical blower at minimum, is needed to meet the aeration demand for peak influent BOD conditions. The existing diffuser array design will need to be reviewed to ensure that it can handle the additional aeration capacity before bringing another blower online.
| Design Condition | Biological Aeration Requirement (SCFM) | Total Aeration Provided (SCFM) | Aeration Deficit (+/-SCFM) |
|---|---|---|---|
| Peak Influent BOD | 728 | 1,100 | -372 |
7. CONCLUSIONS
The Bakery has been unable to maintain and grow biomass on the BioChip carriers and achieve the treatment required to substantially reduce or eliminate discharge surcharges for Biochemical Oxygen Demand (BOD) and Total Suspended Solids (TSS) in their existing MBBR system. However, an eight-week bench test was conducted from January 16, 2020 to March 12, 2020 to confirm that biomass could be grown and maintained on conventional carriers and the conditions required for effective biological treatment.
The findings of the study were:
- The site is in the process of procuring a 10,000-gallon EQ tank. The increased EQ volume was shown to dampen the impact of slug loadings and stabilize primary DAF performance, both of which are pre-requisites for good MBBR performance.
- The reactor was seeded with inoculated media from an existing MBBR system, but pH and temperature shocks early in the test caused the original attached growth to be lost. Attached growth re-established in the last few weeks of testing after pH, alkalinity, and temperature conditions stabilized.
- Good organic removal performance was observed over the last few weeks of testing with 65% and 90% removal observed for COD and BOD, respectively.
- A ramp up schedule was followed to acclimate the reactor to the wastewater. We recommend that the site follow a similar ramp up schedule for the full-scale MBBR acclimation. We recommend that pre-inoculated media be obtained from an existing MBBR facility, if possible, to re-start the MBBR system.
- Foaming was observed during the bench study as wastewater loading was increased. Having the ability to add antifoam to the MBBR reactor, particularly during the startup and acclimation period, is recommended.
- Alkalinity addition will be necessary in the full-scale system to maintain reactor pH, treatment
efficiency, and attached growth. Though magnesium hydroxide addition made sense in the context
of the bench-scale testing because it reacts slowly and mitigated the risk of overshooting the
pH in the reactor, the high addition rate used caused scaling issues in the treatment system. We
recommend that a sodium-based chemical such as sodium hydroxide or soda ash be used to provide
alkalinity in the full-scale system to reduce the risk from inorganic scaling. The grams of
magnesium hydroxide used and conversions to soda ash and caustic are:
- Magnesium hydroxide: 1.6 grams per gallon wastewater
- Soda ash (sodium carbonate): 2.8 grams per gallon wastewater
- Caustic (sodium hydroxide): 2.1 grams per gallon wastewater
- Alkalinity addition should minimize the need for pH adjustment in the reactor; however, occasional pH adjustment using sulfuric acid or sodium hydroxide may still be necessary to maintain reactor pH between 6.8 and 8.0.
- Nitrogen and phosphorus should be added to the wastewater feed using a rule of thumb ratio of 5 mg/L nitrogen per 100 mg/L of BOD and 1 mg/L phosphorus per 100 mg/L BOD initially. The site can then sample the effluent and scale the addition rates up or down to maintain detectable nitrogen and phosphorus residuals.
- Considering space constraints at the site, we don't believe additional MBBR capacity is necessary to substantially reduce surcharge payments. If the MBBR is effectively treating soluble organics as demonstrated during the final weeks of the bench study, a secondary DAF with an effective chemical treatment regimen should be able to consistently reduce the remaining TSS and particulate BOD to below the surcharge thresholds. We recommend that after the MBBR has been returned to service with the appropriate changes and modifications implemented, additional jars testing be conducted to identify the optimal secondary DAF design conditions and treatment chemistry to reduce or eliminate surcharges.
- We recommend that, due to the highly complex nature of industrial wastewater, the treatment system reconfiguration be carefully directed by a licensed professional engineer (PE) with a high level of subject matter expertise. In addition, the treatment system Basis of Design Report (BOD-R) should be revised, updated, and combined with a well written WWTP Operations & Maintenance (O&M) Manual and comprehensive operator training program.